Hands-On Line Graph Activity That Works
Some math lessons stick. Others… well, they vanish faster than the bell at 3:30.
For me, line graphs used to fall into that “forgettable” category—until I swapped abstract numbers for a relatable story.
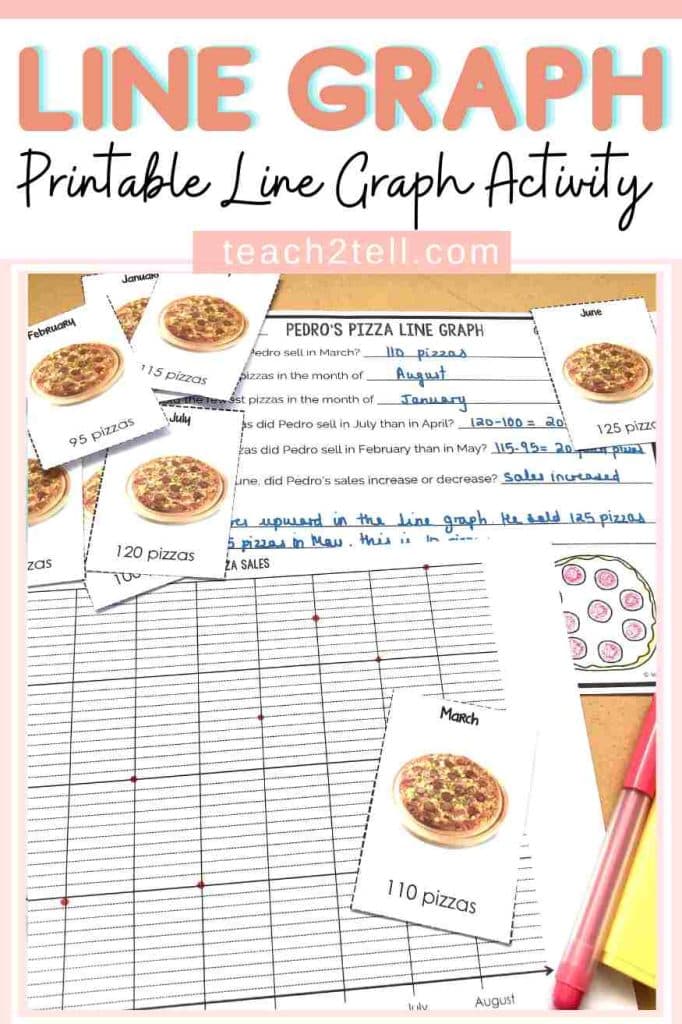
Enter Pedro’s Pizza Shop. This hands-on line graph activity uses a fictional (but totally believable) set of pizza sales data over eight months. Suddenly, students weren’t just plotting dots; they were investigating trends and making sense of changes over time.
Instead of “plot point at 125 on July,” I heard,
“Maybe July’s spike means Pedro had a big sale!”
“April’s dip? Must have been school holidays.”
The shift was immediate. The graph became more than lines—it became a story.
What’s Included in the Data Graphing Activity
This ready-to-use lesson comes with everything you need to set up a no-fuss, high-impact learning session:
-
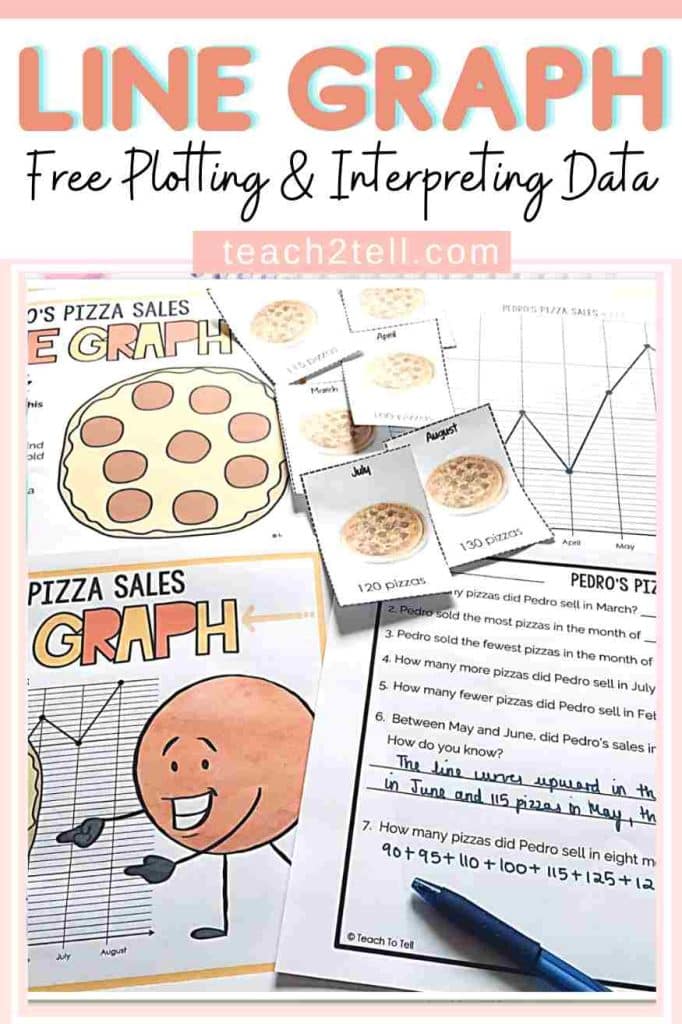
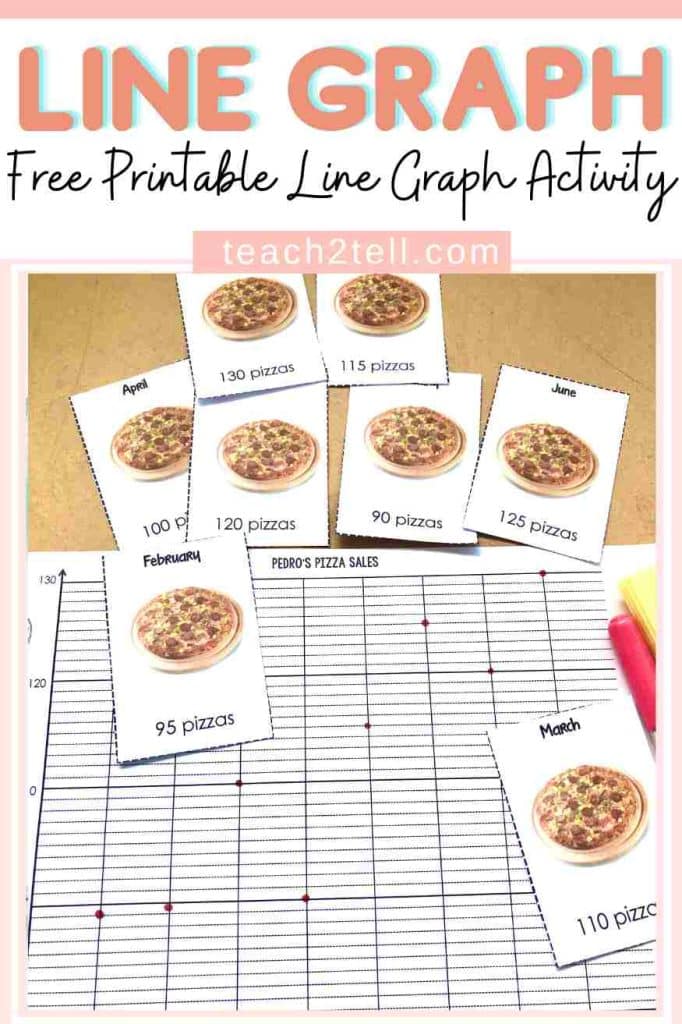
8 data cards showing monthly pizza sales
-
Task cards (full-size and half-size) with simple step-by-step instructions
-
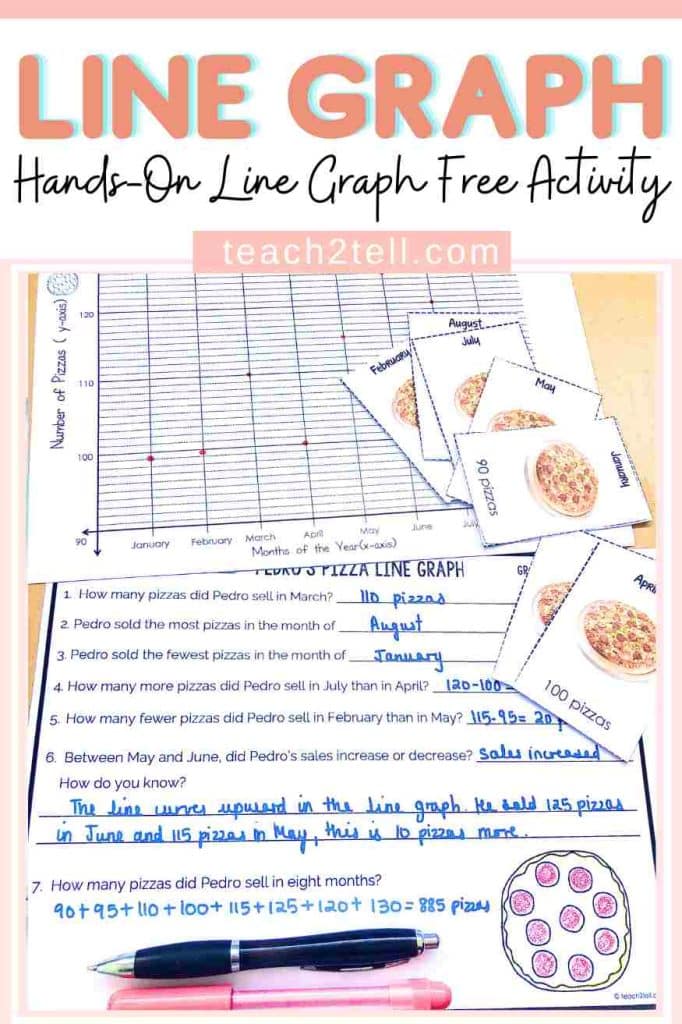
Line graph templates for plotting data
-
Interpretation question sheets to dig deeper into what the data means
-
Vocabulary poster and cards to support key math terms
-
Answer key to make checking quick and easy
Everything can be printed in both large and two-to-a-page formats—because sometimes the photocopier is your biggest hurdle.
How I Used It in My Classroom
I set this up as a math center with students working in pairs.
One student read the sales card aloud, while the other plotted the point on the graph. Then they swapped roles before moving to the interpretation questions.
Here’s what worked best:
-
Pairs over whole class — kept everyone involved and cut down on waiting time.
-
Visual connection — the data cards made the numbers feel real and relevant.
-
Vocabulary in action — instead of memorizing terms, students used them naturally in conversation.
One pair proudly told me, “The trend shows an increase from May to July.” They might not have realized it, but that was exactly the skill I wanted them to master.
Why A Hands-On Line Graph Activity Matters
With graphing, it’s easy for students to focus only on how to plot points and forget why we do it.
This activity makes the “why” obvious—graphs help us see patterns, make predictions, and tell stories with data.
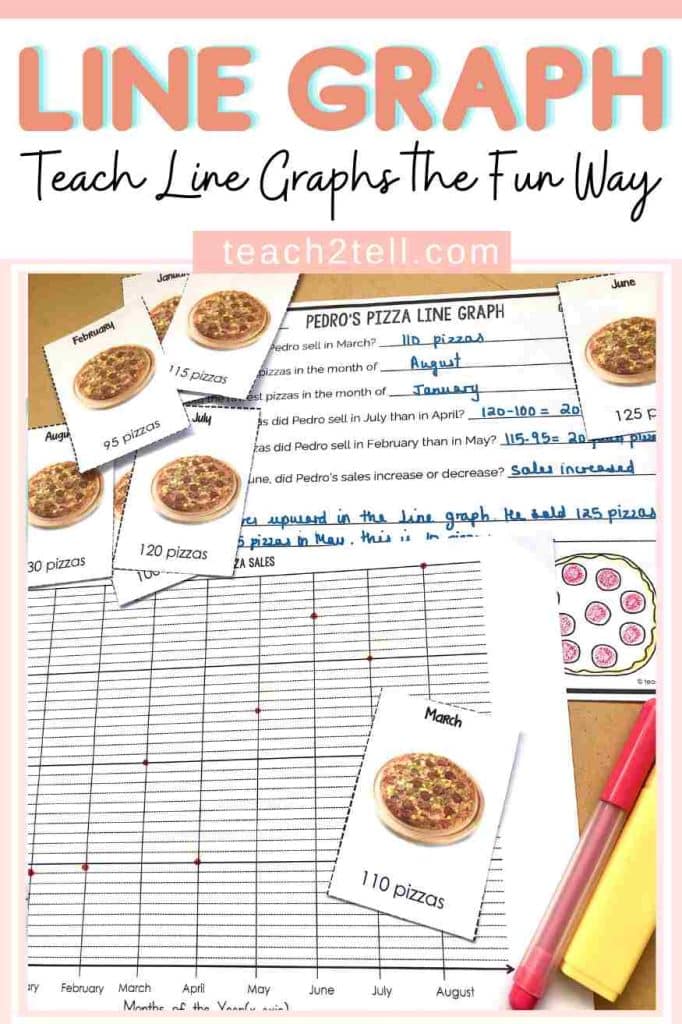
By physically moving cards, placing points, and answering meaningful questions, students engage more deeply than they do with a static worksheet.
Try It in Your Room
You can grab this Pedro’s Pizza Hands-On Line Graph Activity for free and use it in:
-
Math centers
-
Small group instruction
-
Whole-class introductory lessons
👉 Download the free activity here




Leave a Reply